


📊 Create Summarized Financials


Summarized financial statements are a huge value add in any sort of financial reporting…and they are actually really easy to prepare.
If you have the Model Wiz plugin, you can instantly generate dashboards like these right in your Excel file with a few clicks of a button.

Today, I'll walk you through the importance of preparing summarized financial statements and provide you with a step-by-step guide on how to create them on your own.


Your financial statements tell you about the financial health of your company and are one of the most common ways in which financial data is communicated.
But there are a few problems.
👎 Financial statements can be too long to fit on slides.
Your Profit & Loss will oftentimes take up dozens and dozens of rows.
This makes it very challenging to put in a slide deck and present it to stakeholders
👎 It’s easy to get overwhelmed with data
When you review a report with so many lines, it isn’t immediately apparent where there are anomalies that require investigation.
👎 It’s difficult to identify patterns
When you don’t have your financial statements summarized, it becomes difficult to identify trends in cost groupings or departments
When you summarize your financial statements, all of these problems disappear.
So how do you do it? It’s actually really easy…

Start by exporting your Profit & Loss and Balance Sheet from your accounting software.
You can also export your statement of cash flows, or instead generate your own via the indirect method.

Add a new column after your account list called “Summary Grouping”, and start mapping out each account to the summary grouping that you want it to show under.

Be careful not to classify any accounts with the word "Total" in them as that will cause double-counting.


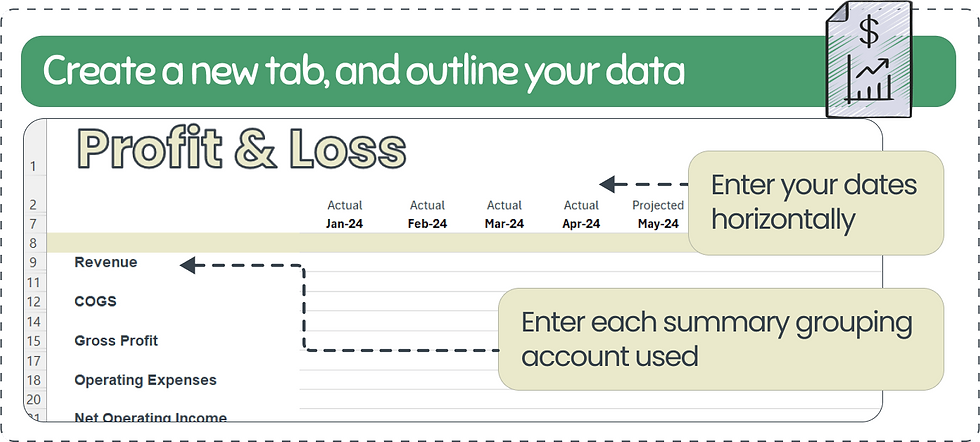
Now that you know what summary groupings you will use on your summarized financials, it’s time to outline your dashboard.
Here you can also invest in a pretty design with a relevant header and color scheme.

Now is where the magic takes place. The SUMIFS formula allows you to SUM values IF they meet 1 or more criteria.
So you’ll SUM the values in each month if the summary groupings column equals the line you are in.


Now that you have your data pulled in by month, it’s time to aggregate things on an annual and quarterly basis to give you greater context into what’s happening.

I like to prepare summarized dashboards as a first step in analyzing my data and then drilling down into any accounts that seem off…this saves me time and helps me identify issues much more quickly than going line by line.
If you want to learn more about this topic, check out this video.
Plus it makes for a great dashboard to report on!
What has your experience been with summarizing financials?
Till next time

Josh (Your CFO Guy)
Thanks for reading my article. My goal is to help you grow in your career with proper Finance and Accounting.
If we're not already connected on Social media, let's get connected and send me a message to say hi. I promise to respond


