

Josh Aharonoff
Apr 27, 2023
Welcome back to another edition of Legit Numbers - it's great to have you here!
In this edition, we'll be covering how I create Excel dashboards, understanding balance sheet ratios, and exploring the top KPIs every CEO should know.
As always, feel free to respond to this email and share your thoughts with me!
What we’ll be covering in this edition:
How I create Excel dashboards
10 Balance Sheet Ratios
Accounts Payable
Difference between a Profit & Loss and a Balance Sheet
10 KPIs every CEO should know
Let's dive in...
1️⃣ Get your data in a table format
The first step is to get my data into a more flexible format so that it’s easier to run formulas
My favorite method for accomplishing this is power query
With power query I can unpivot dates so that they show in 1 column
Anytime my data changes, I can just hit “refresh”, and it’s ready to be used
2️⃣ Shrink down rows & columns size on a new tab
Once I have my data ready to use, I then create the canvas for my dashboard in a new tab
I often times will shrink down the rows & columns of the new tab...
making it’s easier to control the design
3️⃣ Create date selectors
In order to pull in the right data, I set up fields where my start and end dates will go
Then I do the same for comparison dates
I use data validation to create an easy to use dropdown for these dates
These will be some of the most important inputs for my dashboard
4️⃣ I then start outlining my first KPI
I’ll start merging cells where appropriate
and setting the styles of each cell to match my color scheme
5️⃣ I use sumproduct to pull in my values
This is one of the most powerful formulas in excel
and it makes it so easy to get the data you need
My formula will often times look like this
=SUMPRODUCT((Data[Value)*(Data[KPI]=C29)*(Data[Dates]>StartDate)*(Data[Dates]≤EndDate))
Where C29 is the metric I want to showcase
and StartDate and EndDate are the inputs from my date selectors up top
6️⃣ I use custom formatting to showcase “increase ▲” and “decrease ▼”
Custom formatting is one of my favorite tools
Here you can specify the value if your result is positive, negative, or blank
like this
“increase ▲”; “decrease ▼”; 0
Just press CTRL + 1, and go to custom on the bottom to set the formatting
7️⃣ I copy the KPI over to complete the dashboard
If my calcs were set up correctly, I can now reuse this component easily
Then all I need to do is change the KPI name in each box
and it should update with the right values
8️⃣ Finish it up with a nice header & footer
Now comes the finishing touches…
I like to give a nice pretty title & footer to wrap things up
if I’m using powerpoint, I may just skip this part
That’s how I create a dashboard from start to finish
↓ Click the image below to get a free copy of this dashboard ↓

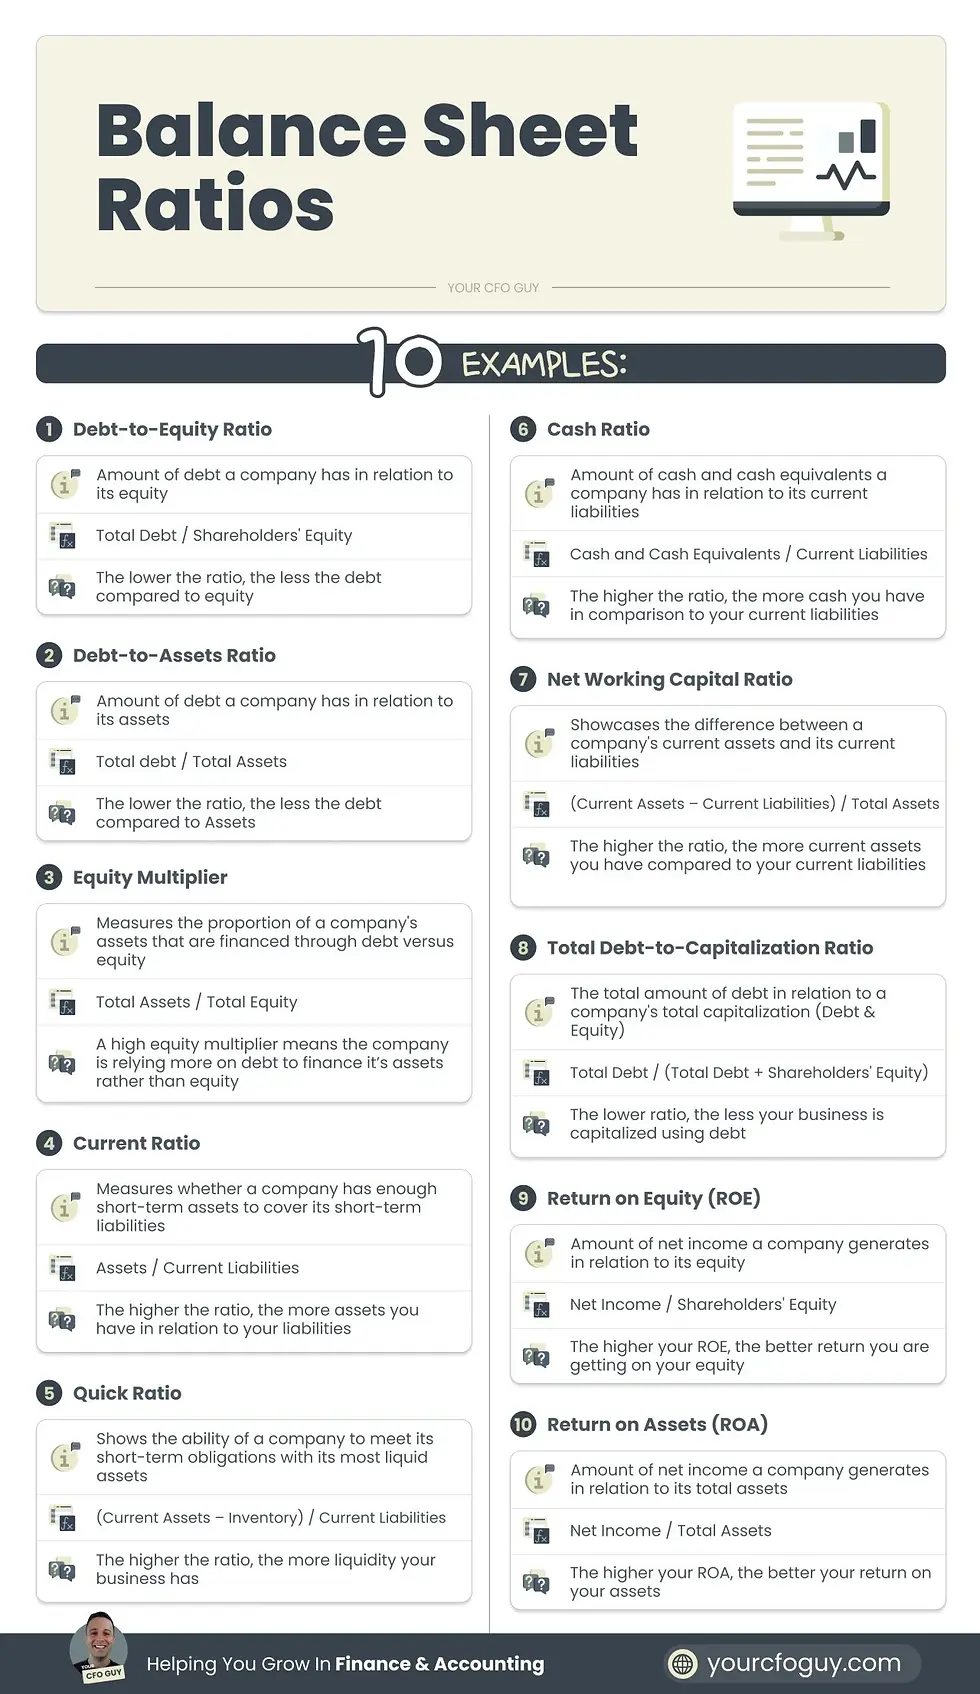
1️⃣ Debt-to-Equity Ratio
What it means→ Amount of debt a company has in relation to its equity
Formula→ Total Debt / Shareholders' Equity
How to interpret→ The lower the ratio, the less the debt compared to equity
2️⃣ Debt-to-Assets Ratio
What it means→ Amount of debt a company has in relation to its assets
Formula→ Total debt / Total Assets
How to interpret→ The lower the ratio, the less the debt compared to Assets
3️⃣ Equity Multiplier
What it means→ Measures the proportion of a company's assets that are financed through debt versus equity
Formula→ Total Assets / Total Equity
How to interpret→ A high equity multiplier means the company is relying more on debt to finance it’s assets rather than equity
4️⃣ Current Ratio
What it means→ Measures whether a company has enough short-term assets to cover its short-term liabilities
Formula→ Current Assets / Current Liabilities
How to interpret→ The higher the ratio, the more current assets you have in relation to your current liabilities
5️⃣ Quick Ratio
What it means→ Shows the ability of a company to meet its short-term obligations with its most liquid assets
Formula→ (Current Assets – Inventory) / Current Liabilities
How to interpret→ The higher the ratio, the more liquidity your business has
6️⃣ Cash Ratio
What it means→ Amount of cash and cash equivalents a company has in relation to its current liabilities
Formula→ Cash and Cash Equivalents / Current Liabilities
How to interpret→ The higher the ratio, the more cash you have in comparison to your current liabilities
7️⃣ Net Working Capital Ratio
What it means→ Showcases the difference between a company's current assets and its current liabilities
Formula→ (Current Assets – Current Liabilities) / Total Assets
How to interpret→ The higher the ratio, the more current assets you have compared to your current liabilities
8️⃣ Total Debt-to-Capitalization Ratio
What it means→ The total amount of debt in relation to a company's total capitalization
Formula→ Total Debt / (Total Debt + Shareholders' Equity)
How to interpret→ The lower ratio, the less your business is capitalized using debt
9️⃣ Return on Equity (ROE)
What it means→ Amount of net income a company generates in relation to its equity
Formula→ Net Income / Shareholders Equity
How to interpret→ The higher your ROE, the better return you are getting on your equity
🔟Return on Assets (ROA)
What it means→ Amount of net income a company generates in relation to its total assets
Formula→ Net Income / Total Assets
How to interpret→ The higher your ROA, the better your return on your assets
Those are 10 examples - but there are more!
➡️ What it means
Money a company owes to its suppliers and vendors for goods and services purchased on credit
➡️ Where it shows up
On the Liabilities section of the Balance Sheet
➡️ Why it’s important
1️⃣ Cash Flow Management - a higher AP balance can mean that you are utilizing favorable cash flow measures for the near future, however it’s important to keep track as the amount can catch up with you
2️⃣ Relationship with Suppliers - It’s important to keep track of your AP balance or your relationship with suppliers may worsen, leading to future issues with purchasing goods & services on credit, or legal action
➡️ Common AP formulas
1️⃣ Accounts Payable Turnover Ratio: Measures how many times a company pays off its accounts payable balance during a specific period.
Formula: Purchases on Credit / Average Accounts Payable
Alternate Formula: COGS / Average Accounts Payable Balance
💡A high Accounts Payable Turnover Ratio means that the company is paying off it’s outstanding AP more quickly
2️⃣ Days Payable Outstanding (DPO): Represents the average number of days it takes a company to pay its suppliers.
Formula: Accounts Payable / Purchases on credit * Number of days.
Alternate formula: Average AP / COGS * Number of Days
💡A Lower DPO means the company is paying off it’s AP balance more quickly
3️⃣ Average Age of Accounts Payable: Measures how long a company takes to pay off its debts
Formula: Accounts Payable / Annual Credit Purchases / 365
Alternate Formula: Accounts Payable / Average Daily Cost of Goods Sold
💡A lower Average Age of Accounts Payable means the company pays it’s AP balance more quickly
➡️ Common Journal Entries
1️⃣ When purchasing good or services on credit…
Debit Software expense (or the relevant account)
Credit Accounts Payable
2️⃣ When paying off AP balance
Debit Accounts Payable
Credit Cash

Do you know the difference between a Profit & Loss and a Balance Sheet?
They are both crucial in Finance & Accounting, yet each tell you different information
Let’s start with some definitions…
➡️ What is a Profit & Loss (P&L)?
In plain English, a P&L tells you what you’re net earnings are, which is the sum of what you’re EARNING, less the expenses you’re INCURRING
In accrual based accounting, that’s all dependent on when the events take place...
In cash accounting, that’s all based on when cash comes in vs goes out
➡️ What is a Balance Sheet?
A Balance Sheet tell you the net worth of your business…
Essentially showing you what you OWN (Assets)…
how much of those assets were funded by creditors (Liabilities)...
and how much of those assets were funded by owners / prior earnings (Owners Equity)
🤔 So how do these 2 statements differ from one another?
Well….a P&L is all about helping you understand the net profitability of your business, without any consideration to what possessions you have, and who you owe money to
For that reason, a P&L is run from a specific start date to a specific end date - often times showing YTD, and grouped by month
A Balance Sheet on the other hand primarily communicates your financial position at an EXACT point in time. IE, the balances shown there are cumulative
Taking a look at just your P&L, you may think the business is doing really well in terms of earnings…
But then analyzing your Balance Sheet, you may see that the company has an unsustainable amount of debt that will eventually cripple your organization
🤔 If I had to choose just ONE of these statements to analyze a business, which would it be?
A Balance Sheet
Because a Balance Sheet includes information that comes from your P&L in an account called Retained Earnings…
That’s pretty much the sum of all of your prior net income amounts from your P&L…
You won’t be able to tell the details of what makes up those earnings by just looking at the Balance Sheet...
but you can still get an idea as to what the net earnings each period were

Every month, I work with dozens of CEOs who are trying to understand what is happening with their business
The best CEOs that I work with have quick insight into what matters, allowing them to act FAST
1️⃣ Cash Burn
Cash is king - your whole business revolves around it
Understanding how much your spending, and how that spend will be affected by certain actions, can add tremendous value to your decision making
2️⃣ Cash Out Date
Startups typically post losses every month with the intention of raising capital at higher valuations
But what happens if you are taken by surprise?
you can be left with a real delicate situation…
Causing you to have to raise / borrow capital at unfavorable terms
Or even worse…you may go out of business 😱
3️⃣ Cash in the bank
Noticing a trend here? Cash is king!
Understand everything there is about it
4️⃣ Monthly Recurring Revenue
After you master everything there is to know about your cash, it’s time to master everything there is to know about what contributes / withdraws from that cash
Your sales is what brings cash in the door, and is often times what investors value the most
Understand not only your Monthly Recurring Revenue, but also how much new MRR, Lost MRR, and Expansion / Contraction MRR taking place each month
5️⃣ Monthly Headcount Expense
Your headcount expense will be the biggest expense each month, and the hardest to control - get a grip on it before it’s too late!
6️⃣ Budget Attainment
How do you know if your forecast is credible?
By preparing a budget vs actuals each month
From there, you can see where you were on point, and when you need to reforecast with different assumptions
7️⃣ Gross Margin
Your Gross Profit is an important metric - it allows you to understand how much money you can invest in your business after you deliver your revenue
You can be making a billion dollars in revenue..if it costs you a billion + 1 dollars to generate that, you don’t have a business
8️⃣ Churn
Churn is like a virus that can spread if not treated quickly
Find out why your customers are churning, and do everything you can to prevent more of it
9️⃣ Customer Acquisition Cost (CAC)
Sales is cool…but not if it takes you more money in Sales & Marketing to acquire a customer
Once you understand your CAC, you can do all sorts of cool analysis like CAC Payback, IE calculating how long it takes you to earn back your CAC
🔟 Lifetime Value
Similar to the above, it’s not enough to understand how much you’re earning
When you understand how much in lifetime value customers are worth, you can invest in the right Sales & Marketing channels

And that brings us to the end of this week's edition of Legit Numbers.
If you found this digest informative and engaging, I'd be grateful if you could take a quick 30 seconds to share your thoughts and feedback with me here.
As always, I'm open to suggestions on new topics to cover, so please don't hesitate to respond to this email and let me know your ideas.
Until next week, stay curious and keep learning with Your CFO Guy.